Faculty Statistics |
||||||||||
Full-Time |
||||||||||
| 2013 | 2014 | 2015 | 2016 | 2017 | 2018 | 2019 | 2020 | 2021 | 2022 | |
| Instructional | 331 | 332 | 344 | 344 | 360 | 365 | 386 | 390 | 419 | 530 |
| Minorities | 37 | 37 | 40 | 39 | 42 | 45 | 48 | 54 | 55 | 85 |
| % Minority | 11.1% | 11.1% | 11.7% | 11.3% | 11.6% | 12.3% | 12.4% | 13.8% | 13.1% | 16.6% |
| Female | 169 | 168 | 173 | 166 | 173 | 180 | 192 | 194 | 206 | 277 |
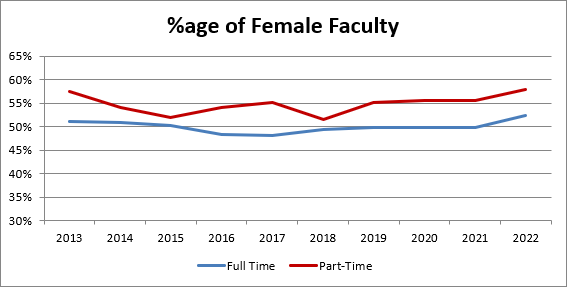
| % Female | 51.1% | 50.6% | 50.3 | 48.2% | 48.1% | 49.3% | 49.7% | 49.7% | 49.2% | 52.3% |
| Male | 162 | 164 | 171 | 178 | 187 | 185 | 194 | 196 | 213 | 253 |
| Nonresident Aliens | 1 | 1 | 4 | 1 | 3 | 5 | 7 | 4 | 5 | 3 |
| Doctorate or Other Terminal Degree | 271 | 283 | 296 | 306 | 318 | 326 | 341 | 345 | 350 | 418 |
| % With Terminal Degree | 81.9% | 85.2% | 86.5 | 88.9% | 88.1% | 89.3% | 88.3% | 88.5% | 83.5% | 78.9% |
Part-Time |
||||||||||
| 2013* | 2014 | 2015 | 2016 | 2017 | 2018 | 2019 | 2020 | 2021 | 2022 | |
| Instructional | 404 | 413 | 437 | 484 | 492 | 550 | 508 | 454 | 500 | 401 |
| Minorities | 29 | 26 | 31 | 33 | 29 | 45 | 46 | 49 | 70 | 45 |
| % Minority | 7.2% | 6.3% | 7.1% | 6.8% | 5.3% | 8.2% | 9.1% | 10.8% | 11.0% | 12.3% |
| Female | 232 | 223 | 227 | 262 | 271 | 283 | 280 | 252 | 292 | 231 |
| % Female | 57.4% | 54.0% | 52.2% | 54.1% | 55.1% | 51.5% | 55.1% | 55.5% | 58.4% | 57.8% |
| Male | 172 | 190 | 210 | 222 | 221 | 267 | 228 | 202 | 207 | 169 |
| Nonresident Aliens | 1 | 1 | 0 | 3 | 3 | 3 | 2 | 3 | 2 | 1 |
*Beginning in 2022, Belmont changed the classification of Five-Month Lecturers and Faculty Fellows from part-time to full-time.