Belmont University measures student success using nationally recognized standards of student achievement appropriate to Belmont's mission, the nature of students it serves, and the kinds of programs offered. This includes measuring freshman to sophomore retention rates and 6-year graduation rates. Belmont University tracks undergraduate retention and graduation rates using the methodology outlined by IPEDS (the Integrated Postsecondary Education Data System.) Belmont University also compares our student outcome results to a group of peer institutions of similar size, location and/or mission as a measure of success.
Retention Rates
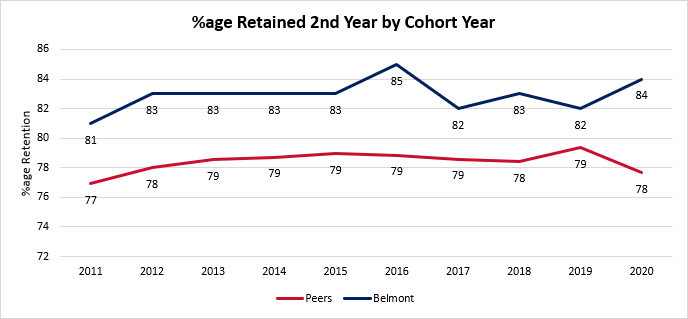
Retention rates reflect the percentage of first-time, full-time, degree-seeking freshman entering the university in the given year who retained into their second academic year. Belmont has established an aspirational goal of 88% for retention of first-time degree-seeking students with a minimum threshold of 80%. Based on 2020 IPEDS retention rates, the latest available reported year, Belmont's freshman to sophomore retention rate of 82% exceeds our peer group's mean of 79%.
Graduation Rates
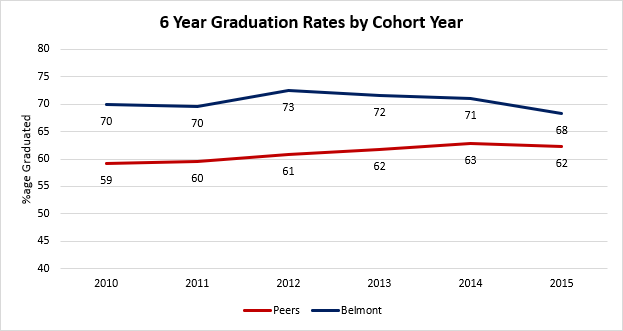
Graduation rates reflect the percentage of first-time, full-time, degree-seeking freshman entering the university in the given year who graduated within 150% of the normal program length. Belmont has established an aspirational goal of 75% for a 6-year graduation rate for first-time degree-seeking students with a minimum threshold of 70%. Based on 2021 IPEDS graduation rates, the latest available reported year, Belmont's 6-year graduation rate of 68% exceeds our peer group's mean of 62%.
Undergraduate Retention and Graduate Rates
All First-Time Full-Time Students by Cohort
| Cohort | Head Counted | Adjusted Count | % Retained 2nd Year | % Graduated in 4 Years | % Graduated in 6 Years |
|---|---|---|---|---|---|
| 2011 | 1,153 | 1177 | 81% | 58% | 69% |
| 2012 | 1,256 | 1279 | 83% | 61% | 71% |
| 2013 | 1,243 | 1267 | 83% | 60% | 72% |
| 2014 | 1,392 | 1457 | 83% | 59% | 71% |
| 2015 | 1,387 | 1457 | 83% | 57% | 68% |
| 2016 | 1,568 | 1631 | 85% | 65% | 72% |
| 2017 | 1,565 | N/A | 82% | 61%* | 71%* |
| 2018 | 1,561 | N/A | 83% | 60%* | |
| 2019 | 1,675 | N/A | 82% | 58%* | |
| 2020 | 1,587 | N/A | 84% | ||
| 2021 | 1,827 | N/A | 84% | ||
| 2022 | 1,910 | N/A | 84% |
* - Graduation rates not yet reported to IPEDS and subject to change
These data reflect the most recently submitted IPEDS reporting data. Cohorts 2019 and earlier may be adjusted during the IPEDS reporting based on the inclusion of students from the O'More College of Art and Design and/or the Walkings College of Art.
Cohort includes first time full time freshmen for summer or fall of indicated term. Prior to 2016, University College is not included.
To view Athlete Rates, go to: Belmont Bruins