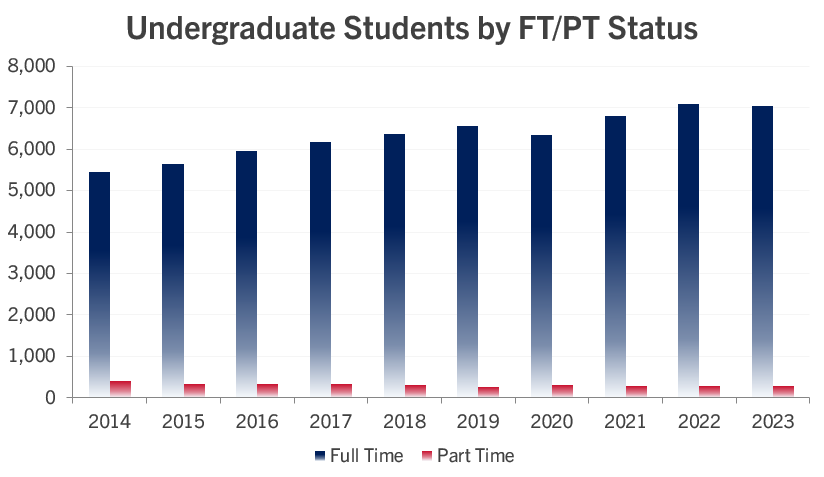
Undergraduates by FT/PT Status
| Full-Time | ||||||||||
|---|---|---|---|---|---|---|---|---|---|---|
| Year | 2014 | 2015 | 2016 | 2017 | 2018 | 2019 | 2020 | 2021 | 2022 | 2023 |
| Number | 5,440 | 5,639 | 5,951 | 6,161 | 6,367 | 6,563 | 6,330 | 6,792 | 7,100 | 7,042 |
| % Change | 6% | 4% | 6% | 4% | 3% | 3% | -4% | 7% | 5% | -1% |
| Part-Time | ||||||||||
|---|---|---|---|---|---|---|---|---|---|---|
| Year | 2014 | 2015 | 2016 | 2017 | 2018 | 2019 | 2020 | 2021 | 2022 | 2023 |
| Number | 397 | 344 | 342 | 336 | 299 | 257 | 301 | 284 | 284 | 296 |
| % Change | 2% | -13% | -1% | -2% | -11% | -14% | 17% | -6% | 0% | 4% |
| Total Undergraduate Enrollment | ||||||||||
|---|---|---|---|---|---|---|---|---|---|---|
| Year | 2014 | 2015 | 2016 | 2017 | 2018 | 2019 | 2020 | 2021 | 2022 | 2023 |
| Number | 5,837 | 5,983 | 6,293 | 6,497 | 6,666 | 6,820 | 6,631 | 7,076 | 7,384 | 7,338 |
| % Change | 6% | 3% | 5% | 3% | 3% | 2% | -3% | 7% | 4% | -1% |
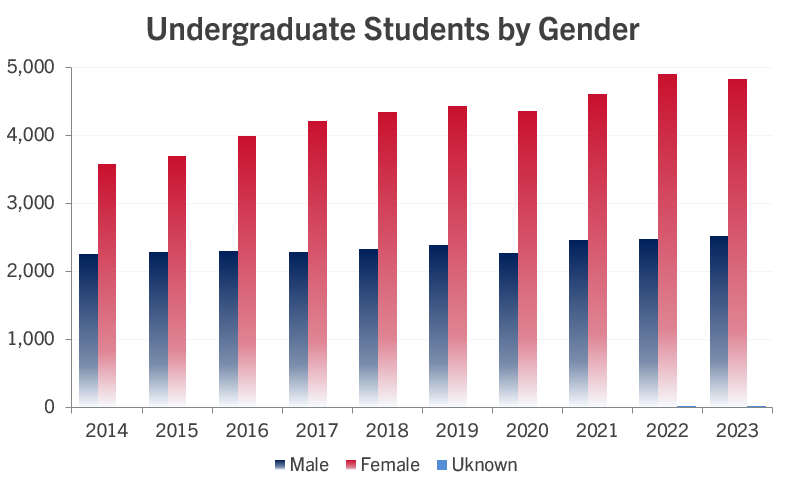
Undergraduates by Gender
| Male | ||||||||||
|---|---|---|---|---|---|---|---|---|---|---|
| Year | 2014 | 2015 | 2016 | 2017 | 2018 | 2019 | 2020 | 2021 | 2022 | 2023 |
| Number | 2,255 | 2,287 | 2,305 | 2,291 | 2,329 | 2,392 | 2,267 | 2,463 | 2,480 | 2,513 |
| % of Total | 39% | 38% | 37% | 35% | 35% | 35% | 34% | 35% | 34% | 34% |
| Female | ||||||||||
|---|---|---|---|---|---|---|---|---|---|---|
| Year | 2014 | 2015 | 2016 | 2017 | 2018 | 2019 | 2020 | 2021 | 2022 | 2023 |
| Number | 3,582 | 3,696 | 3,988 | 4,206 | 4,337 | 4,428 | 4,364 | 4,613 | 4,900 | 4,822 |
|
% of Total |
61% | 62% | 63% | 65% | 65% | 65% | 66% | 65% | 66% | 66% |
| Unknown* | ||||||||||
|---|---|---|---|---|---|---|---|---|---|---|
| Year | 2014 | 2015 | 2016 | 2017 | 2018 | 2019 | 2020 | 2021 | 2022 | 2023 |
| Number | 4 | 3 | ||||||||
| % of Total | 0%+ | 0%+ | ||||||||
| Total Undergraduate Enrollment | ||||||||||
|---|---|---|---|---|---|---|---|---|---|---|
| Year | 2014 | 2015 | 2016 | 2017 | 2018 | 2019 | 2020 | 2021 | 2022 | 2023 |
| Number | 5,837 | 5,983 | 6,293 | 6,497 | 6,666 | 6,820 | 6,631 | 7,076 | 7,384 | 7,338 |
*Beginning with Fall 2022, IPEDS allows students to be reported as gender unknown.
+Percentage of students for whom gender is unknown is 0.05% for Fall 2022 and 0.04% for Fall 2023
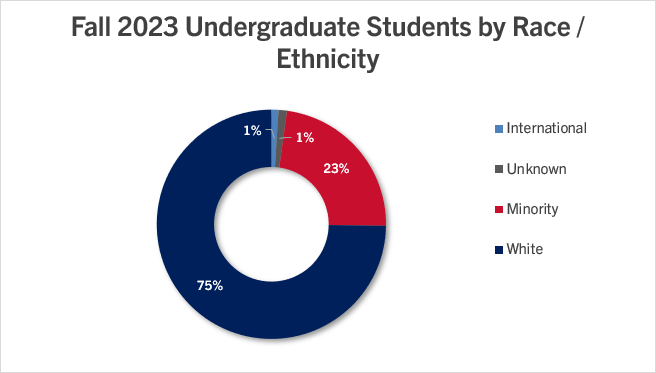
Undergraduate Students by Race/Ethnicity
| US Non-Resident | ||||||||||
|---|---|---|---|---|---|---|---|---|---|---|
| Year | 2014 | 2015 | 2016 | 2017 | 2018 | 2019 | 2020 | 2021 | 2022 | 2023 |
| Number | 72 | 73 | 76 | 88 | 75 | 66 | 45 | 56 | 65 | 73 |
| % of Total | 1.2% | 1.2% | 1.2% | 1.4% | 1.1% | 1.0% | 0.7% | 0.8% | 0.9% | 1.0% |
| Hispanic | ||||||||||
|---|---|---|---|---|---|---|---|---|---|---|
| Year | 2014 | 2015 | 2016 | 2017 | 2018 | 2019 | 2020 | 2021 | 2022 | 2023 |
| Number | 271 | 294 | 311 | 347 | 385 | 434 | 458 | 534 | 619 | 698 |
| % of Total | 4.6% | 4.9% | 4.9% | 5.3% | 5.8% | 6.4% | 6.9% | 7.5% | 8.4% | 9.5% |
| Black or African American, non-Hispanic | ||||||||||
|---|---|---|---|---|---|---|---|---|---|---|
| Year | 2014 | 2015 | 2016 | 2017 | 2018 | 2019 | 2020 | 2021 | 2022 | 2023 |
| Number | 253 | 281 | 308 | 300 | 313 | 340 | 328 | 367 | 366 | 394 |
| % of Total | 4.3% | 4.7% | 4.9% | 4.6% | 4.7% | 5.0% | 4.9% | 5.2% | 5.0% | 5.4% |
| White, non-Hispanic | ||||||||||
|---|---|---|---|---|---|---|---|---|---|---|
| Year | 2014 | 2015 | 2016 | 2017 | 2018 | 2019 | 2020 | 2021 | 2022 | 2023 |
| Number | 4,682 | 4,766 | 5,025 | 5,218 | 5,352 | 5,436 | 5,253 | 5,558 | 5,695 | 5,488 |
| % of Total | 80.2% | 79.7% | 79.9% | 80.3 | 80.3% | 79.7% | 79.2% | 78.5% | 77.1% | 74.8% |
| American Indian of Alaska Native | ||||||||||
|---|---|---|---|---|---|---|---|---|---|---|
| Year | 2014 | 2015 | 2016 | 2017 | 2018 | 2019 | 2020 | 2021 | 2022 | 2023 |
| Number | 15 | 19 | 22 | 20 | 25 | 23 | 17 | 15 | 19 | 22 |
| % of Total | 0.3% | 0.3% | 0.3% | 0.3% | 0.4% | 0.3% | 0.3% | 0.2% | 0.3% | 0.3% |
| Asian, non-Hispanic | ||||||||||
|---|---|---|---|---|---|---|---|---|---|---|
| Year | 2014 | 2015 | 2016 | 2017 | 2018 | 2019 | 2020 | 2021 | 2022 | 2023 |
| Number | 115 | 121 | 147 | 146 | 134 | 140 | 155 | 171 | 212 | 244 |
| % of Total | 2.0% | 2.0% | 2.3% | 2.2% | 2.0% | 2.1% | 2.3% | 2.4% | 2.9% | 3.3% |
| Native Hawaiian or other Pacific Islander, non-Hispanic | ||||||||||
|---|---|---|---|---|---|---|---|---|---|---|
| Year | 2014 | 2015 | 2016 | 2017 | 2018 | 2019 | 2020 | 2021 | 2022 | 2023 |
| Number | 6 | 7 | 6 | 5 | 7 | 7 | 8 | 7 | 8 | 7 |
| % of Total | 0.1% | 0.1% | 0.1% | 0.1% | 0.1% | 0.1% | 0.1% | 0.1% | 0.1% | 0.1% |
| Two or more races, non-Hispanic | ||||||||||
|---|---|---|---|---|---|---|---|---|---|---|
| Year | 2014 | 2015 | 2016 | 2017 | 2018 | 2019 | 2020 | 2021 | 2022 | 2023 |
| Number | 202 | 210 | 220 | 238 | 258 | 289 | 271 | 292 | 317 | 324 |
| % of Total | 3.5% | 3.5% | 3.5% | 3.7% | 3.9% | 4.2% | 4.1% | 4.1% | 4.3% | 4.4% |
| Race and/or ethnicity unknown | ||||||||||
|---|---|---|---|---|---|---|---|---|---|---|
| Year | 2014 | 2015 | 2016 | 2017 | 2018 | 2019 | 2020 | 2021 | 2022 | 2023 |
| Number | 221 | 212 | 178 | 135 | 117 | 85 | 96 | 76 | 83 | 88 |
| % of Total | 3.8% | 3.5% | 2.8% | 2.1% | 1.8% | 1.2 | 1.4% | 1.1% | 1.1% | 1.2% |
| Total | ||||||||||
|---|---|---|---|---|---|---|---|---|---|---|
| Year | 2014 | 2015 | 2016 | 2017 | 2018 | 2019 | 2020 | 2021 | 2022 | 2023 |
| Total | 5,837 | 5,983 | 6,293 | 6,497 | 6,666 | 6,820 | 6,631 | 7,076 | 7,384 | 7,338 |